City intelligence / East region / Proposed opening round
Cambridge vs Ithaca
One-month-ahead home-value forecasting. Compare historical context, forecast uncertainty, and model performance using the same evaluation standard.
Cambridge, MA
East seed 2 · ZIP 02139
Condo/Co-op · Monthly ZHVI
Projected change: pending
Pending
Ithaca, NY
East seed 15 · ZIP selection pending
Condo/Co-op · Monthly ZHVI
Projected change: pending
Forecasting box score10 comparison measures
| Measure | Cambridge | Ithaca |
|---|---|---|
| HISTORICAL CONTEXT | ||
| Months analyzedActual usable monthly observations; target N = 60. | Pending / target 60 | Pending / target 60 |
| Latest typical home valueLatest observed monthly ZHVI, with month. | — | — |
| 5-year average home valueMean of the monthly index values in the analysis window. | — | — |
| 5-year high home valueHighest monthly index value, with month. | — | — |
| 5-year low home valueLowest monthly index value, with month. | — | — |
| Year-over-year changeLatest value versus the same month one year earlier. | — | — |
| FORECAST AND RELIABILITY | ||
| Model usedSelected model and last-value baseline; selection pending. | Not fitted | Not fitted |
| Next-month forecastPredicted value plus dollar and percentage change. | — | — |
| 80% prediction rangeEstimated lower and upper bounds for next month’s value. | Not estimated | Not estimated |
| Historical forecast errorRolling one-month MAE in dollars, versus baseline MAE. | Not evaluated | Not evaluated |
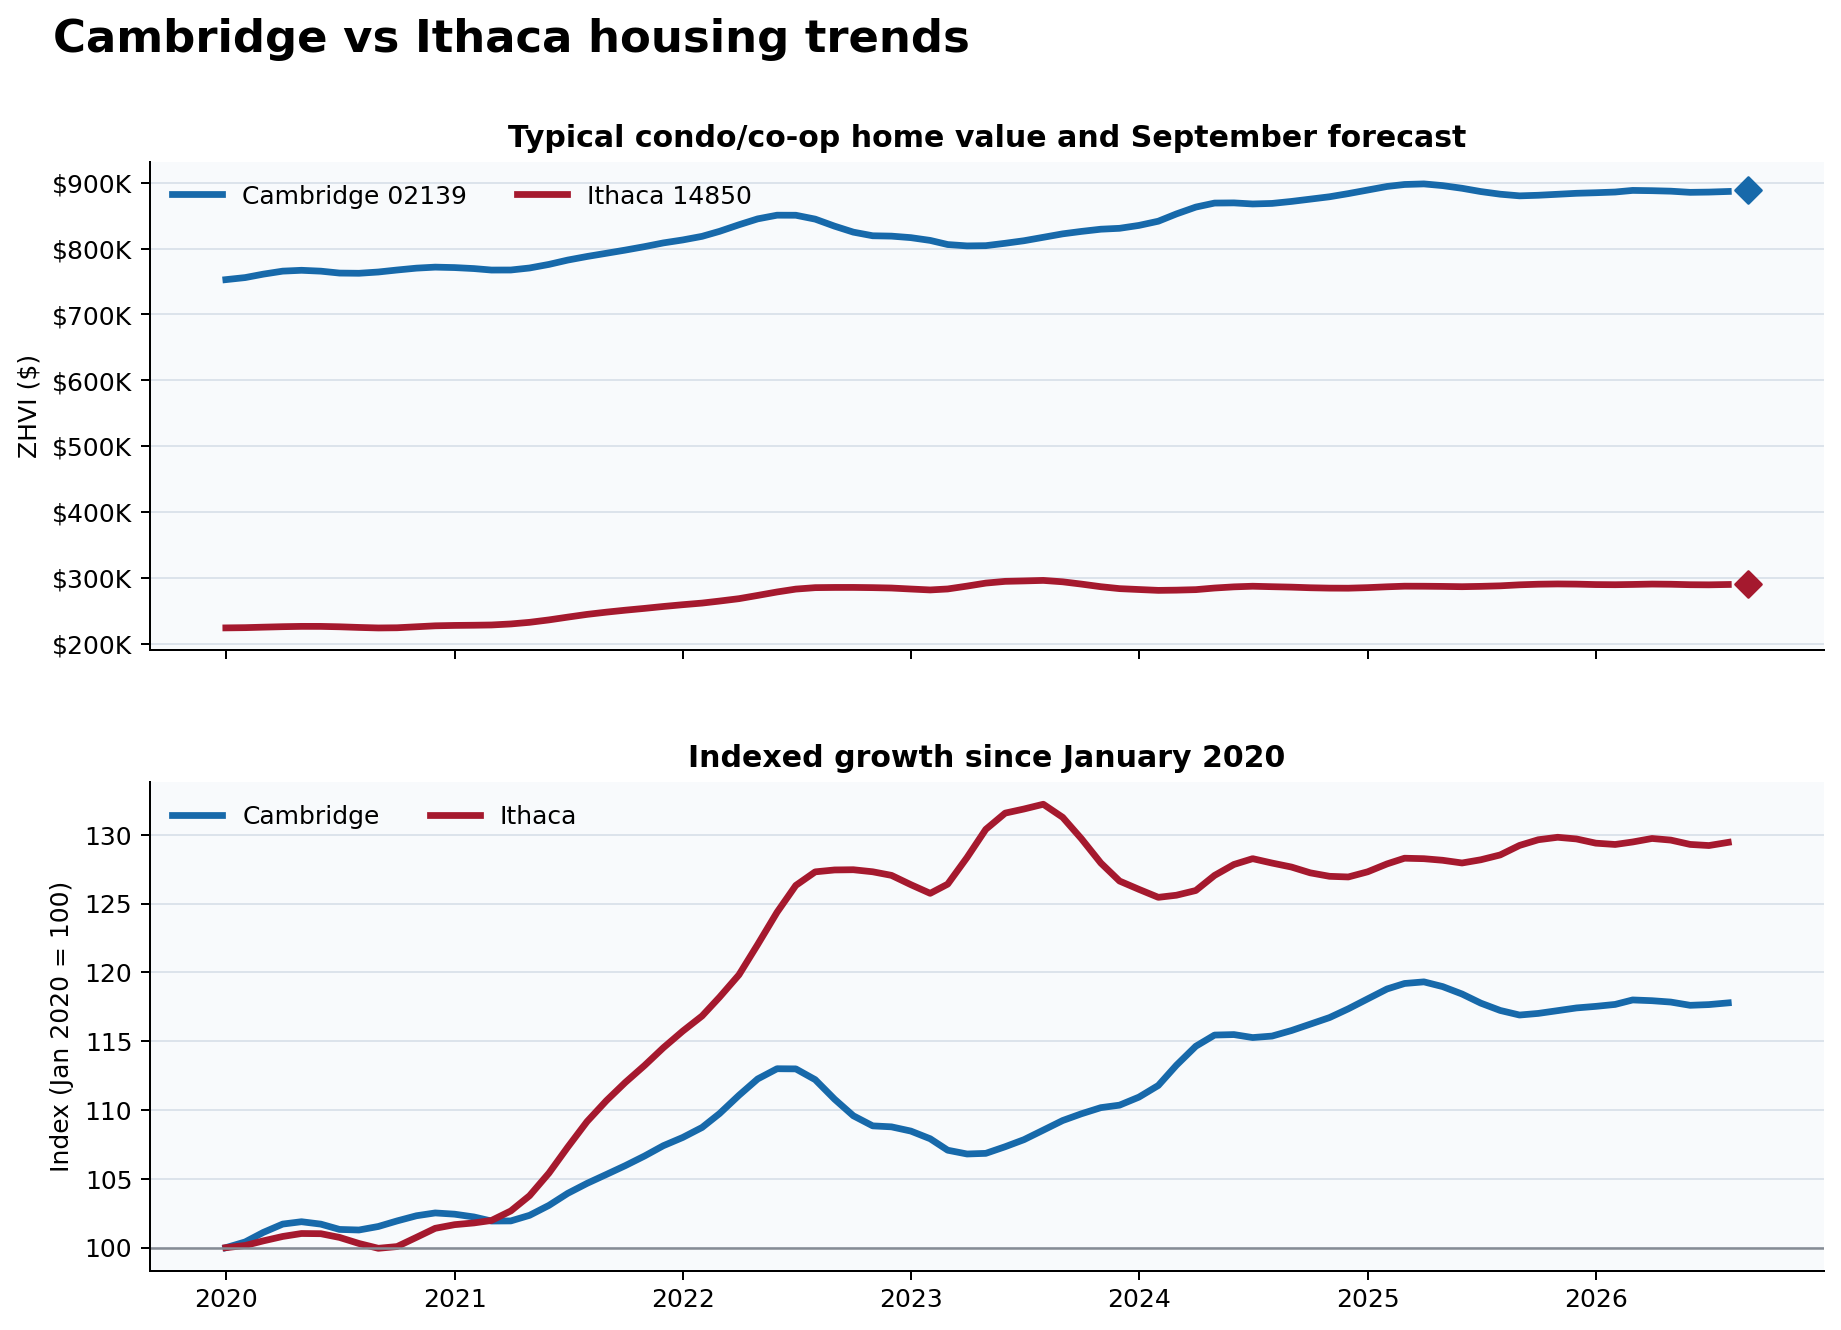
Historical value and forecast
Five years of context. One month ahead.
A monthly value chart and forecast interval will appear after datasets and model outputs are supplied. No illustrative curve is substituted for measured data.
Evaluation protocol
Make the comparison reproducible.
Data definition and scope
Use the same property type, ZHVI series variant, monthly window, data cutoff, and forecast horizon for both ZIP codes. Cambridge uses 02139; the Ithaca ZIP code still needs selection. Confirm each series exists and has adequate coverage. Report actual usable months rather than assuming N = 60.
Historical statistics
For observed values y₁ through yₙ: average = sum(y) / N; high = max(y); low = min(y). Year-over-year change = 100 × (yₜ / yₜ₋₁₂ − 1). High and low describe monthly index values, not individual homes.
Forecast and backtest
Evaluate one-month-ahead predictions with chronological rolling origins. Fit and tune using only information available before each prediction. Compare against a last-observed-value forecast over identical test months. MAE = mean absolute forecast error in dollars. Disclose test count, dates, series vintage, and revisions.
Uncertainty and matchup outcome
Estimate an 80% prediction interval and assess its coverage in backtesting. Do not imply guaranteed coverage. After the next observation arrives, compare absolute errors and error relative to each location’s baseline. A higher home value or larger predicted increase does not establish forecast superiority. Ties and inconclusive results should remain possible.